Healthcare Data Analytics in R
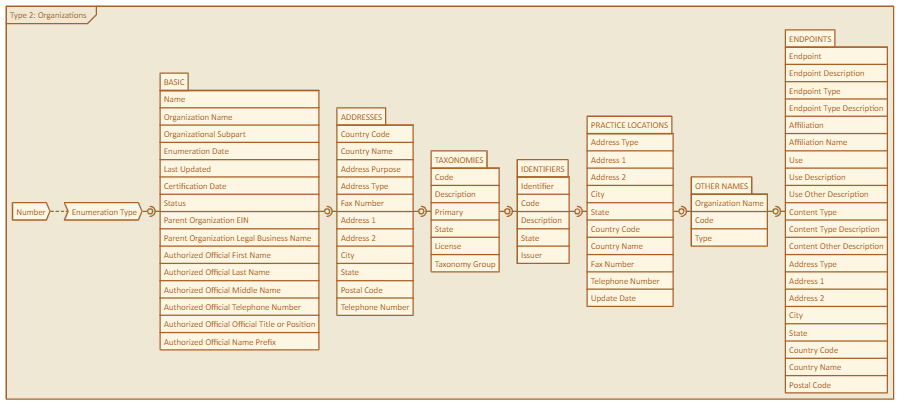
Interacting with an API: NPPES NPI Registry
A short description of the post.
Transparency in Coverage: Parsing JSON in R
A short description of the post.
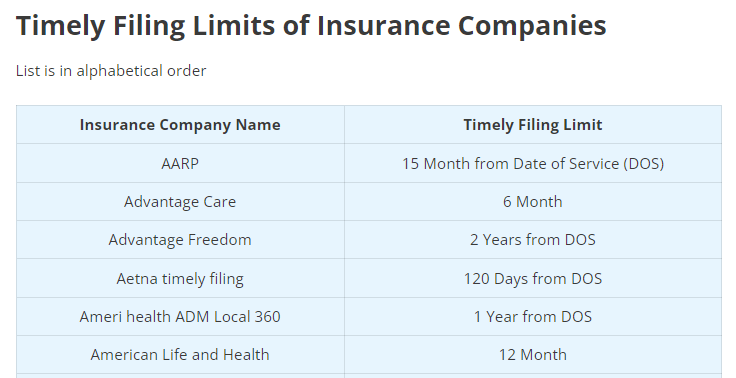
Text Wrangling: Timely Filing Limits
Coding a more intuitive framework for a Timely Filing Limits table from external sources for internal use.
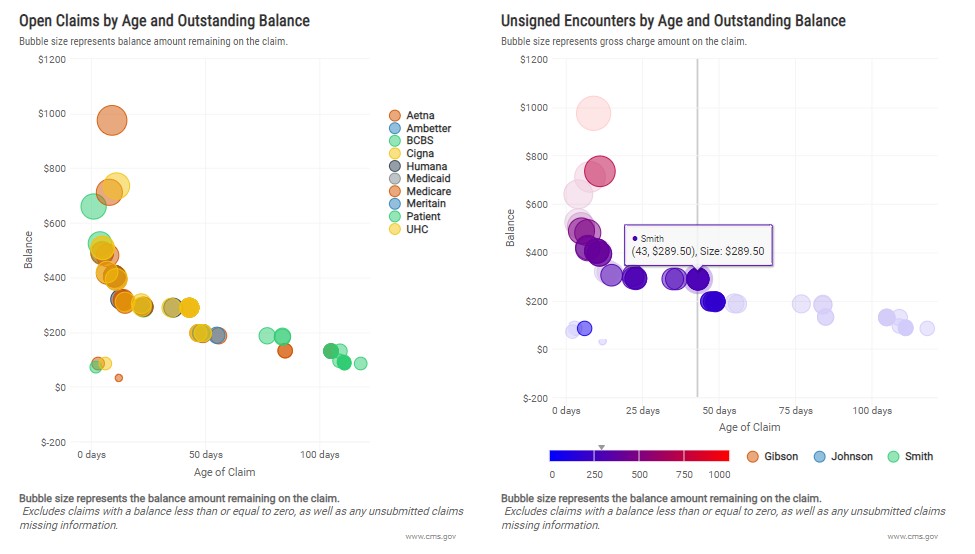
R Cookbook: Aging of Accounts
Personal R code cookbook for common RCM Aging analyses.
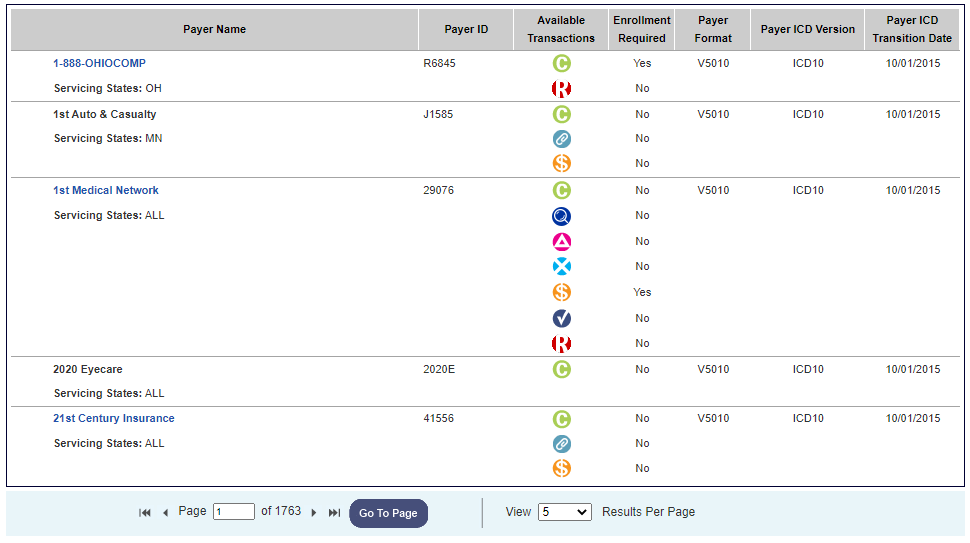
Text Wrangling: EDI Payer List
Coding a more intuitive framework for an EDI Payer List from external sources for internal use.

Chloropleth Maps: Medicare Physician & Other Practitioners Dataset
Create interactive chloropleth maps for more intuitive data visualizations.
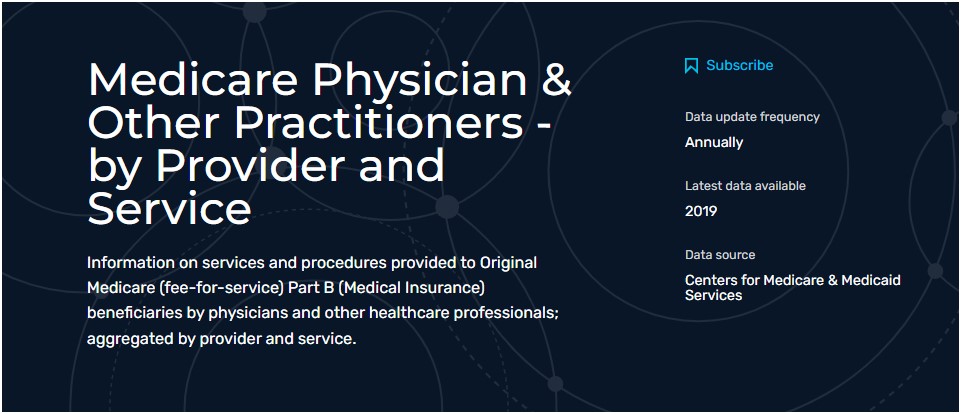
Drill-Down Tables: Medicare Physician & Other Practitioners Dataset
Create interactive drill-down tables for more effective data analysis.
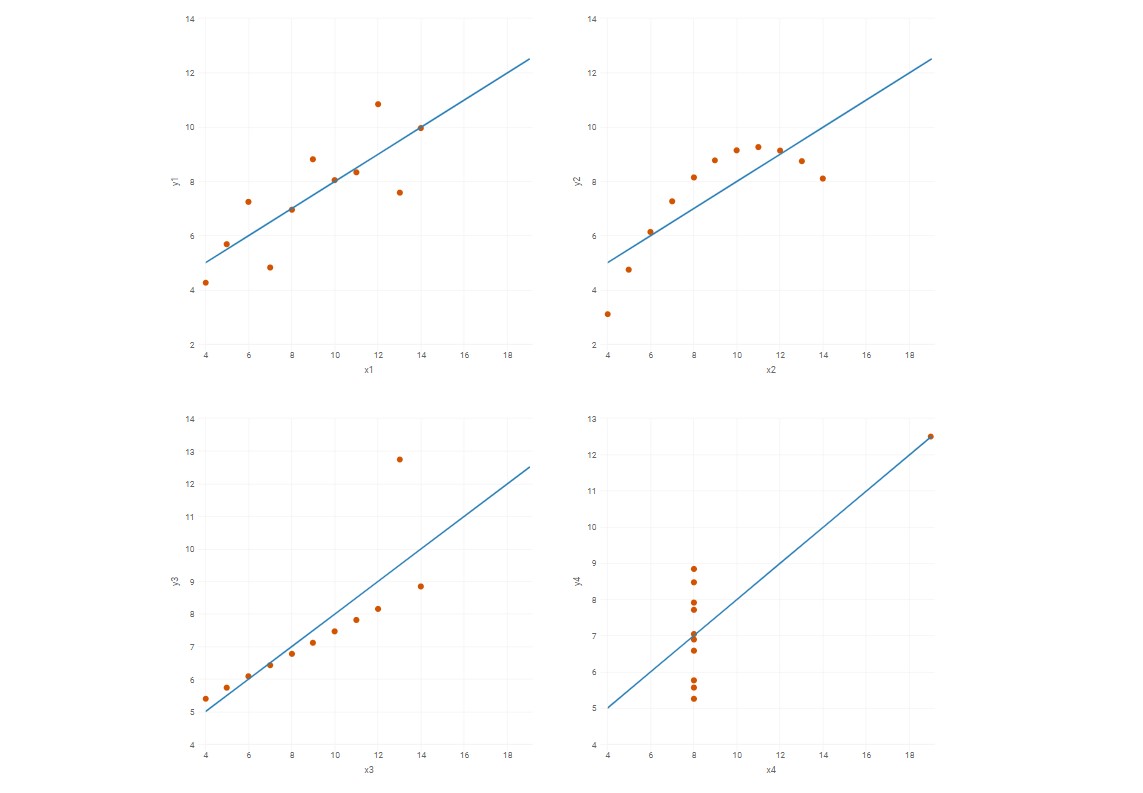
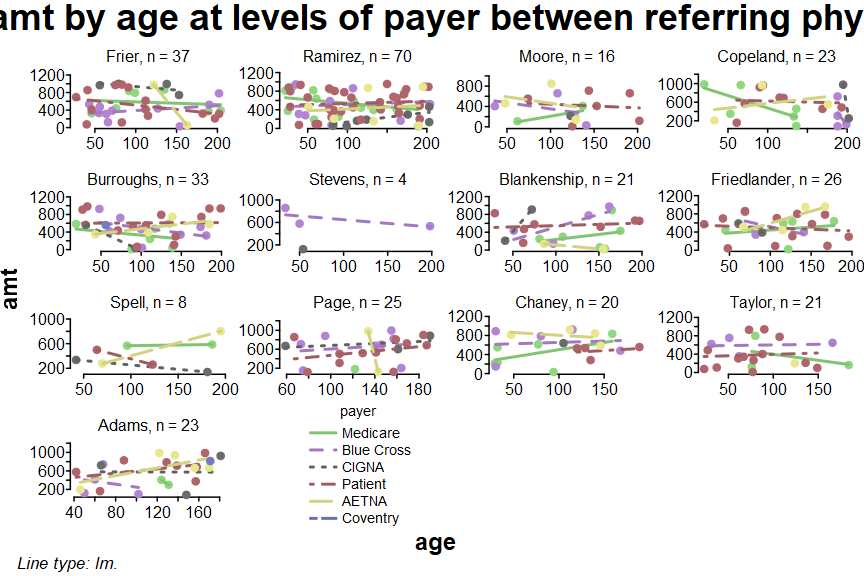
Anscombe's Quartet: Healthcare Edition
A healthcare-centric take on the famous quartet.
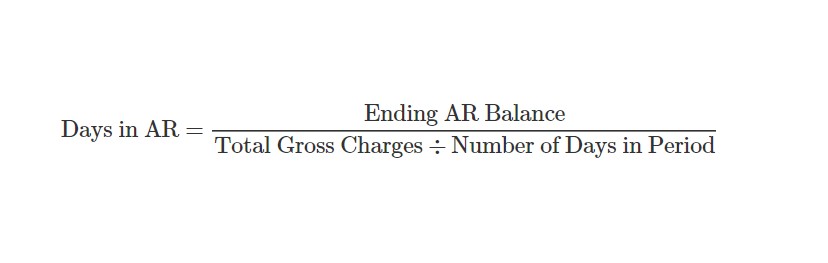
KPI Guide: Days in AR
An (exhaustive) overview of the Days in AR metric from a healthcare reimbursement perspective.
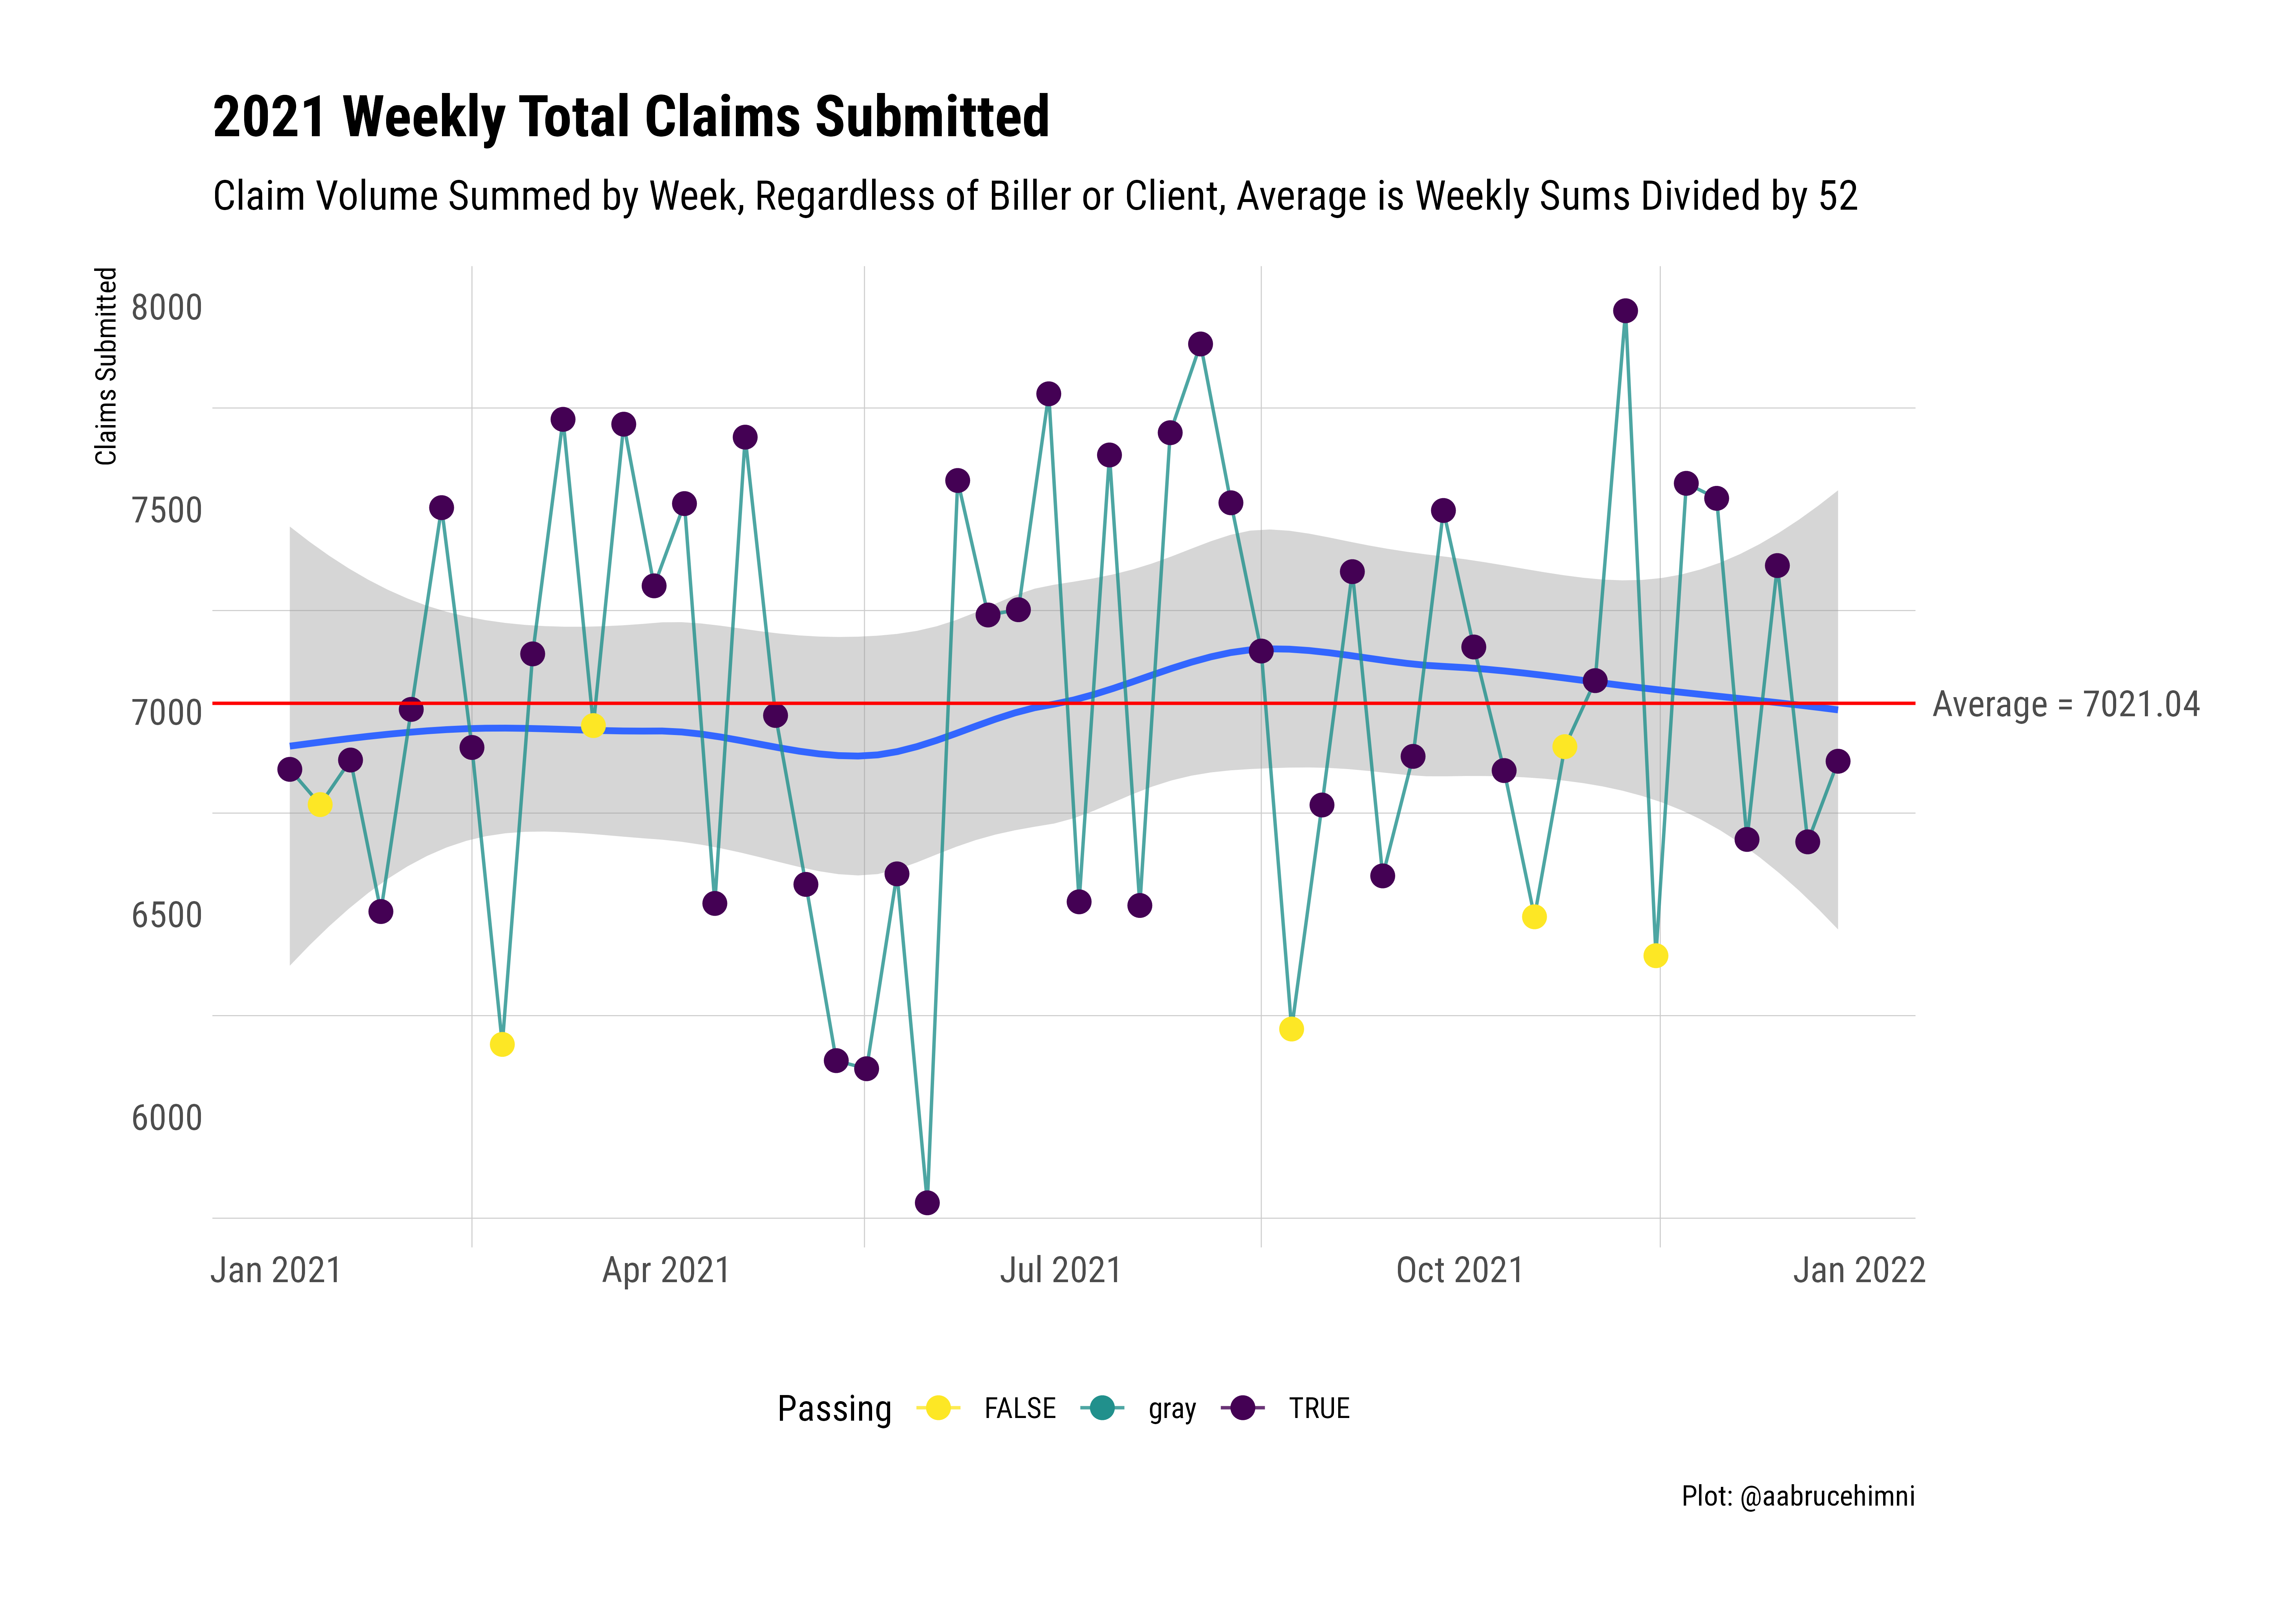
R Cookbook: Medical Billing
Personal R code cookbook for common Medical Billing performance analyses.
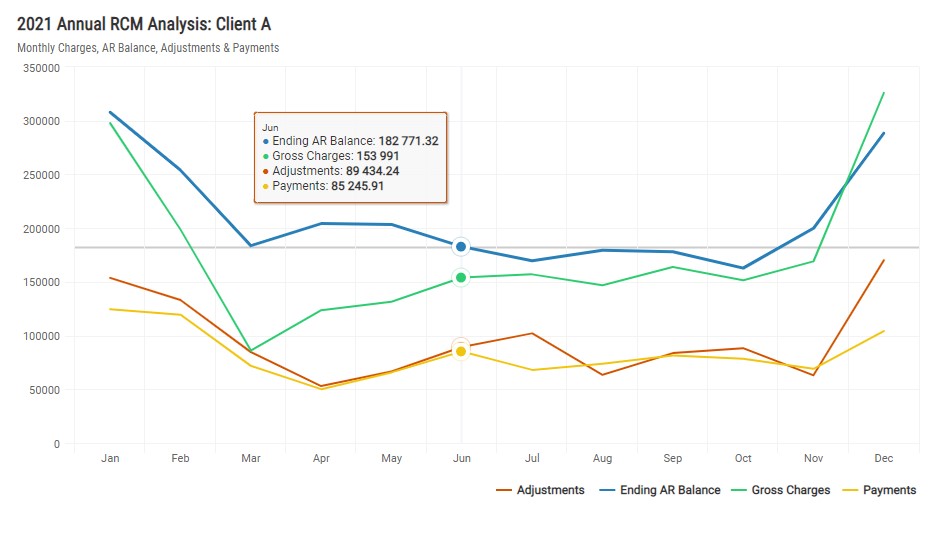
R Cookbook: Healthcare Revenue Cycle
Personal R code cookbook for common Revenue Cycle Management analysis.
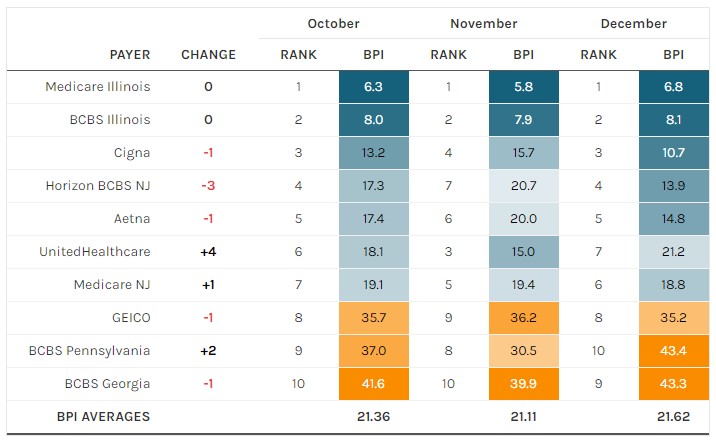
KPI Guide: PARBx & BPI
An overview of Lirov's Percentage of Accounts Receivable Beyond X Days and Billing Performance Index
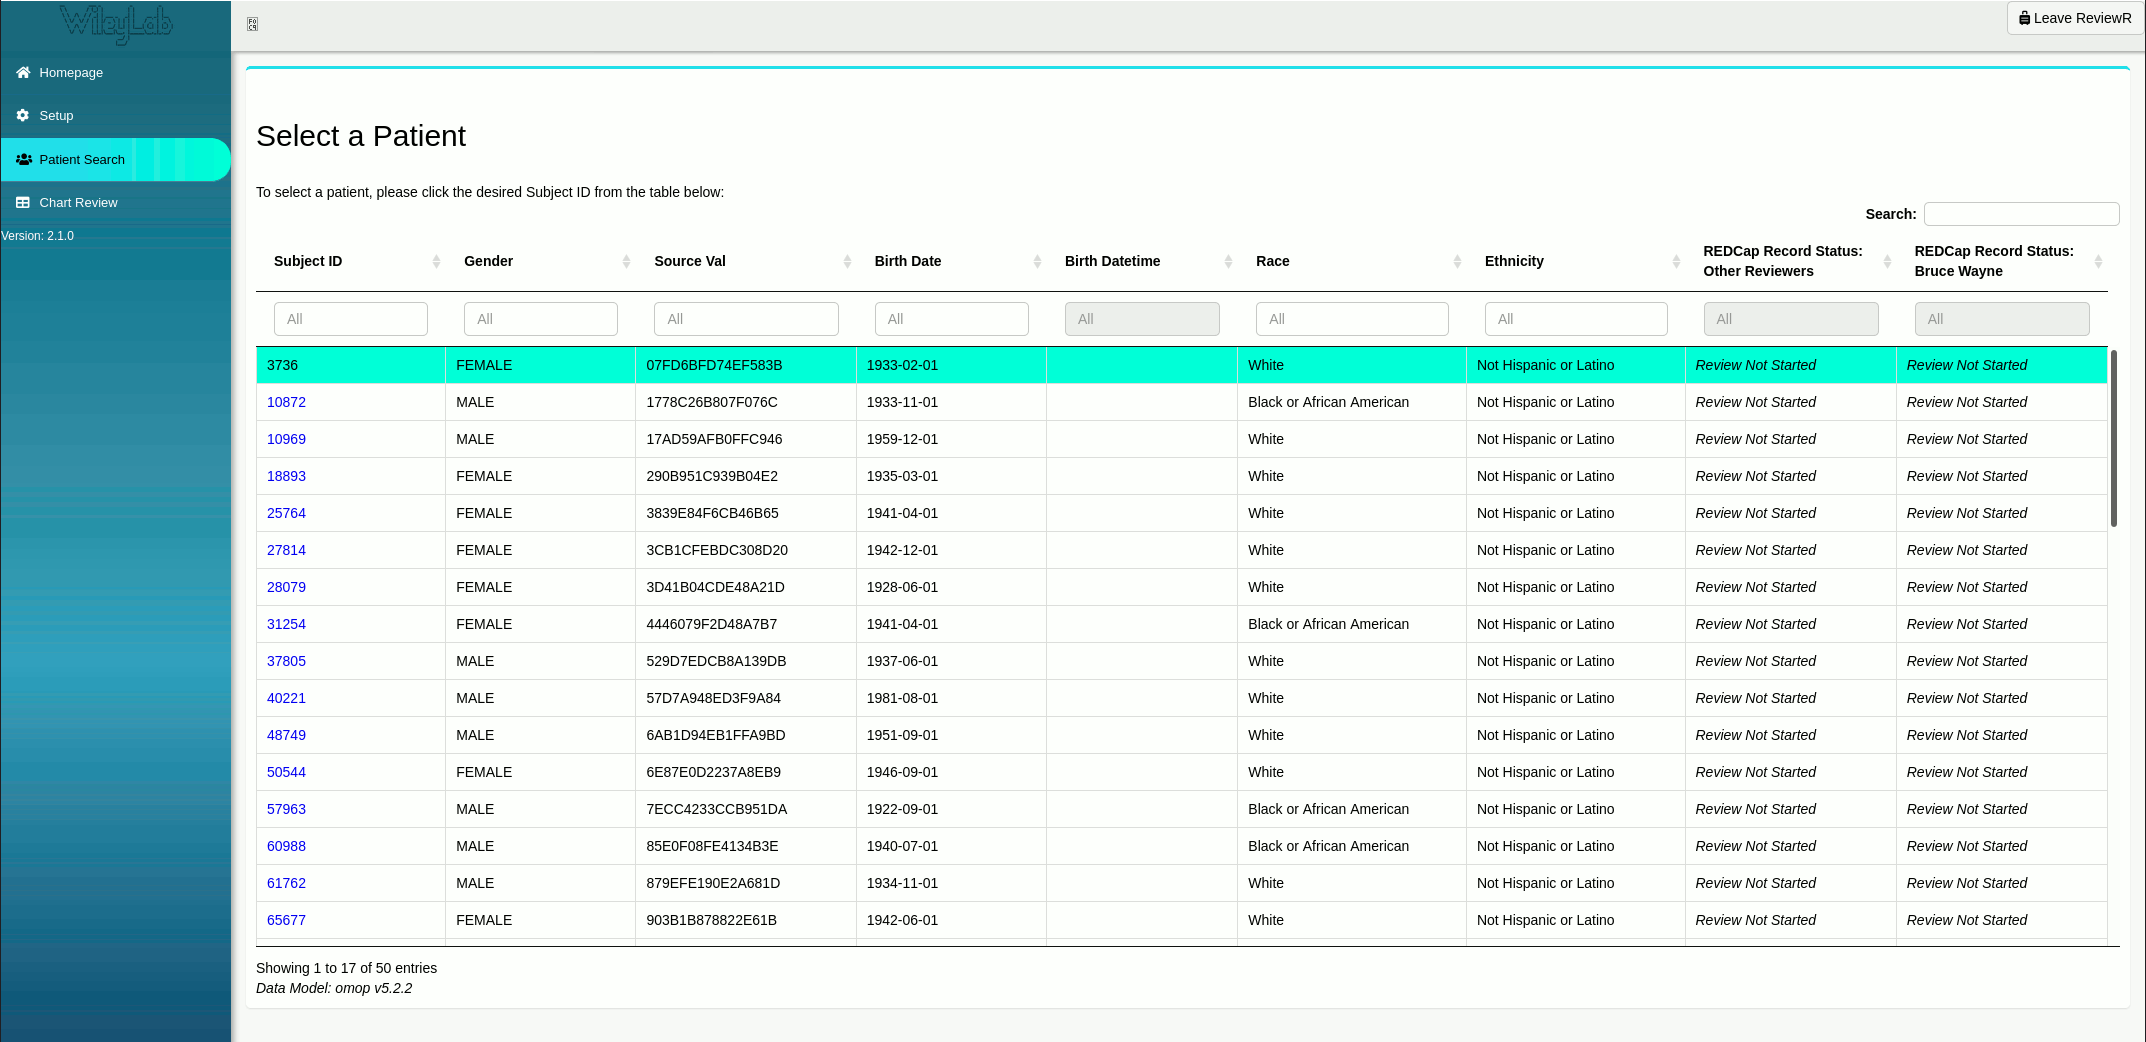
Data Wrangling: EHR Healthcare Claims Data
Using the {tidyverse} to wrangle EHR/EMR healthcare claims data.
Welcome
An #rstats geek in healthcare analytics, here to spread the good word of R.